EC2 Ops & Resource Monitoring Guide
In this guide, we’ll cover system resource monitoring and operational checks for our t3a.large EC2 instance. This instance is running Ubuntu 22.04.5 LTS and comes with:
- 2 vCPUs
- 8 Memory (GiB)
Find more about the instance details here: https://aws.amazon.com/ec2/instance-types/t3/.
System Resource Usage
CPU & Memory
Real-Time CPU Stats
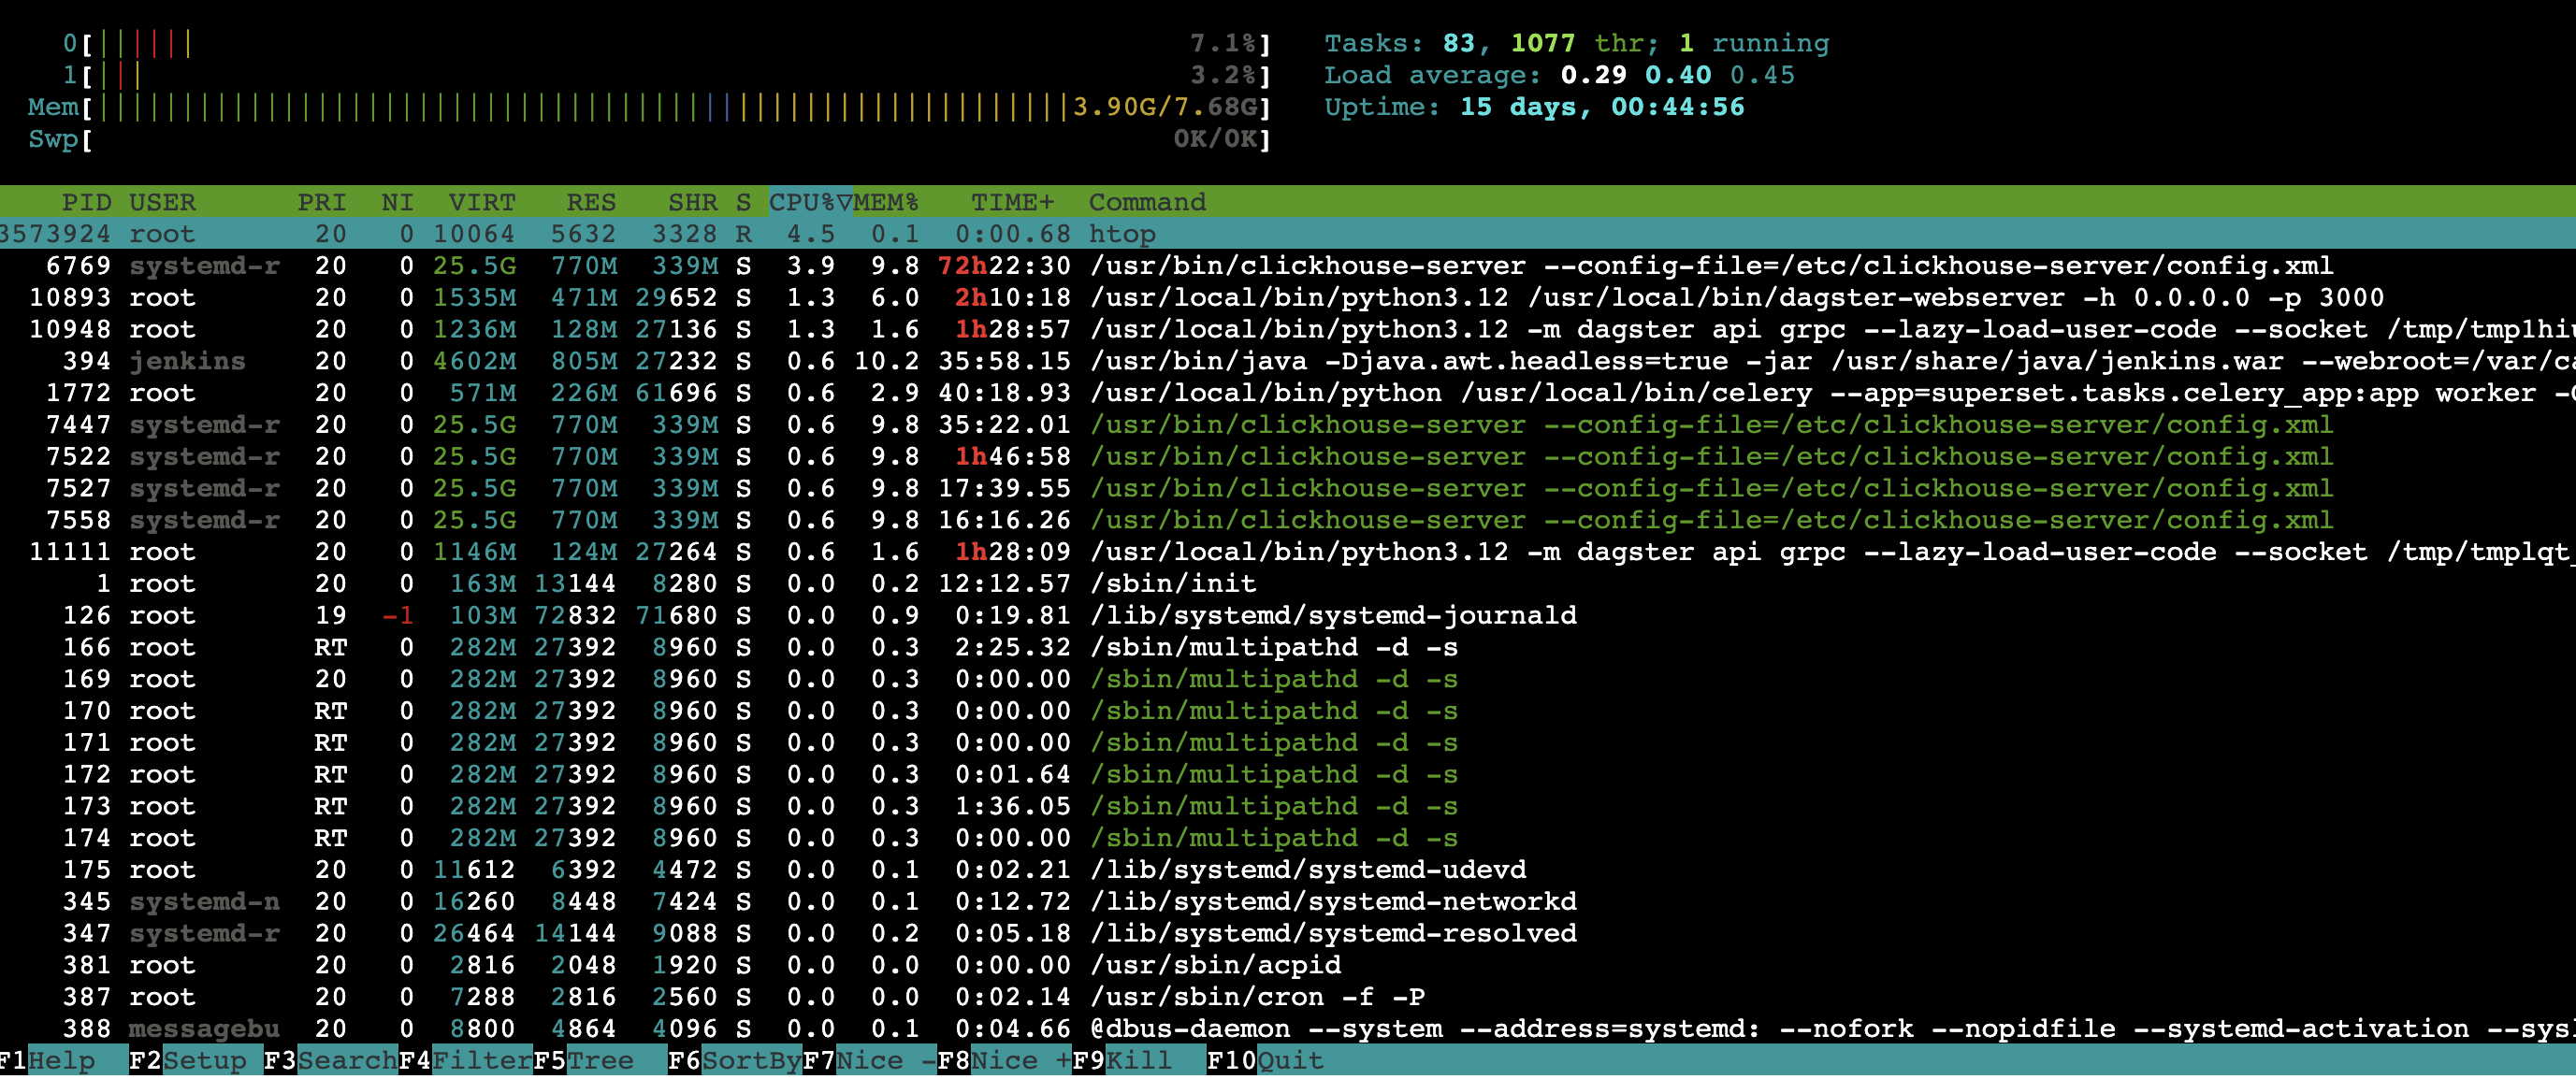
To check live CPU and memory usage, run the following command:
htop
You will see something similar to the image below:
-
CPU Usage (First 2 Rows)
- Displays each CPU core’s usage as a horizontal bar.
- Color codes:
- Green → Normal processes
- Blue → Low-priority processes (nice value > 0)
- Red → Kernel processes
- Orange → IRQ (interrupt) processes
-
Memory Usage (3rd Row)
- Shows the total RAM usage.
- Color codes:
- Green → Used by processes
- Blue → Buffers
- Yellow → Cached memory
-
High swap usage may indicate insufficient RAM.
-
Press
F6or click theF6 SortBybutton in the footer to sort processes by resource usage.
Historical CPU Load
To check the historical CPU load, run the following command:
uptime
You’ll see output similar to:
03:05:14 up 15 days, 51 min, 1 user, load average: 1.13, 0.67, 0.53
- The three load average values represent the system load over the last 1, 5, and 15 minutes.
- If these values are consistently close to 2.00 (the number of vCPUs on a
t3a.largeinstance), it indicates the system is nearing full CPU utilization and may be overloaded.
Memory
Real-Time Memory Stats
To view real-time memory usage, run the following command:
free -h
You’ll see output similar to:
total        used        free      shared  buff/cache   available
7.7Gi       3.9Gi       548Mi        21Mi       3.3Gi       3.5Gi
If the available memory is low, adding new services may lead to performance degradation or swapping.
Disk
To check disk usage, run the following command:
df -h
You’ll see output similar to:
Filesystem       Size  Used Avail Use% Mounted on
/dev/root         49G   30G   19G  61% /
If Use% is greater than 80%, you may run into storage issues when deploying or running new services.
Ports Availability
To check if a specific port is in use, run the following command:
sudo lsof -i -P -n | grep <PORT_NUMBER>
For example, to check if Jenkins is running on port 8090:
sudo lsof -i -P -n | grep 8090
This will list any processes currently using the specified port, helping you avoid conflicts when deploying new services.